Health & Fitness
Dare We Say It? - The USA Housing Market Has Bottomed
In this weeks column we present evidence that the worst of the USA Housing crises is over and that conditions have improved. See how this effects you.


Stock Markets across the globe spent this past week moving sideways and consolidating their recent gains. In the USA, the S&P 500 closed at 1,460 – down just 6 points from last weeks 5 year highs.
The S&P 500 is now just 116 points or 8% away from it’s all time highs that were reached in October of 2007.
Companies making news this week were Apple which reached new highs of $700 a share on the strength of the Iphone 5 which launched this week. Apple has grown so large that the market value of Apple is almost the same as the combined value of Microsoft and Exxon.
Find out what's happening in Woodinvillewith free, real-time updates from Patch.
Also making news this week was FEDEX – the worlds second largest shipping company. FEDEX reported that they are lowering both sales and profit estimates because of slowing demand for their shipping services. The CEO of FEDEX reported that global economic conditions were reaching levels not seen since the last two major downturns in the global economy in the years 2002 & 2007. The CEO stated that the slowdown in China was more pronounced than what many people currently believe and also that much of Europe is in a recession.
We have previously shared similar viewpoints as the CEO of FEDEX with our readers in earlier articles at relianceria.com on the slowing global economy and the USA out-performance compared to the rest of the world.
Find out what's happening in Woodinvillewith free, real-time updates from Patch.
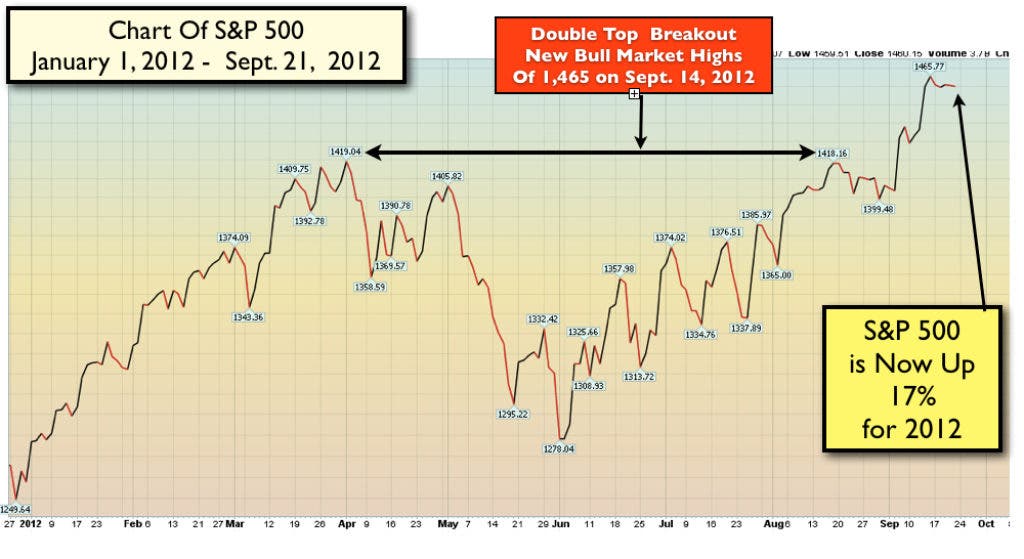
In the Photo Section is a chart of the S&P 500 for the year 2012. We alerted readers two weeks ago about the Double-Top breakout at 1,419 and how this usually results in a further move higher over the short term. This time was no exception as the S&P 500 roared higher once the 1,419 level was cleared.
Much to the delight of investors and 401K holders everywhere, the S&P 500 is now up a remarkable 17% for the year.
The Bottom is In for Housing
With not much activity happening in the stock market this past week, we would like to bring to our readers attention the condition of the USA Housing market.
We all know that for the past 5 years, the housing market has been in a severe depression. Prices of homes have fallen by a percentage basis at the fastest rate in the country’s history. New home activity has been virtually non-existent since the financial crises of 2007 – 2008.
Recently though there are promising signs of optimism for the USA housing market. Signs of a real bottom in housing are evident if we are looking for it in the right places. We explore this further by presenting three charts to our readers. These three charts (Found in the Photo Section) present the following information:
- How optimistic or Pessimistic Companies who Build New Homes are.
- How much Home prices are changing on a percentage basis.
- New Home Sales.
One measure of the health of the New Home Building industry is the monthly report of the “National Association of Home Builders Sentiment Index”. This economic report is prepared from surveys of home building companies across the USA. It is a measurement of how good (or bad) that the companies who build new homes are feeling about their business conditions.
We took the data from the most recent report and broke it down by region – the regions are:
- West
- Midwest
- Northeast
- South
Then we prepared a chart (by region) to show the last 12 months (Sept. 2011 – Sept. 2012) of how optimistic or pessimistic the companies that build homes are on their business each month.
Well as you can see in the NAHB chart in the Photo Section – home builders optimism have turned significantly higher over the past 12 months. Last September 2011, home builders in the West reported a 16 (a depression level number) on the NAHB sentiment index. Today in September 2012 – Home-builders in the West are reporting a 43 – a significantly higher optimistic viewpoint than they had 12 months ago.
Notice the strong growth in optimism for home-builders in all four regions of the USA that continues to get stronger through each month of 2012:
The September, 2012 results were six year highs for this index.
Indeed it does appear that the companies who are in the business of building new homes believe that the worst of the housing crises is now behind us.
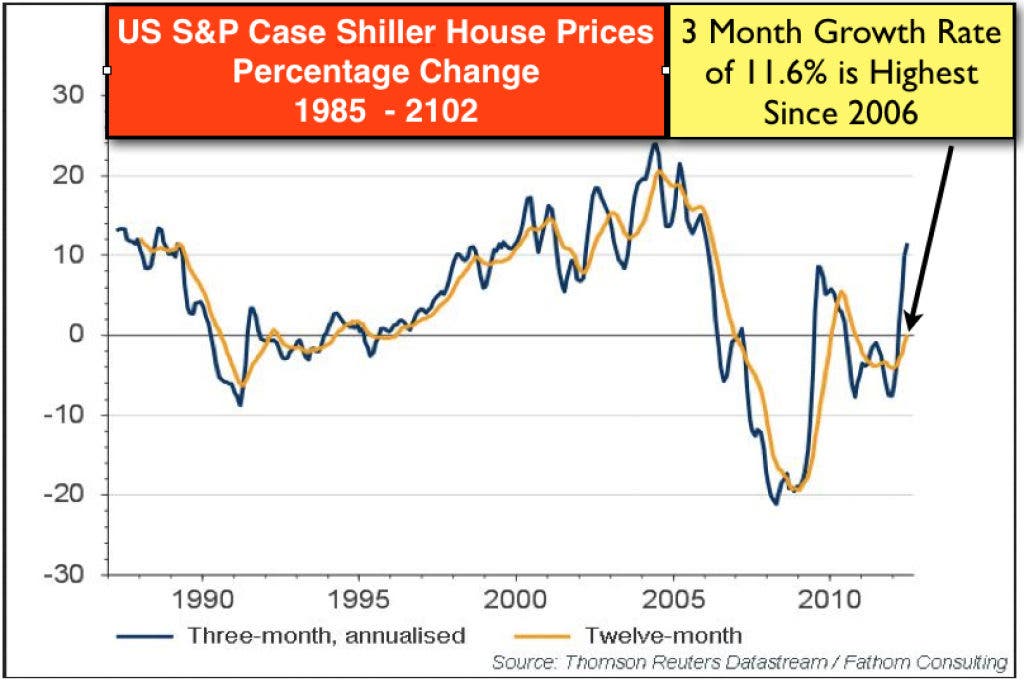
The next chart found in the Photo Section uses data form the Case Shiller house prices index and focuses on the change in housing prices across the USA.
This chart is a 27 year chart that shows the rate of housing price increases and decreases in the USA.
To what could be a surprise to many people, over the past three months house prices in the USA have increased at an annual rate of 11.6% – this is the fastest rate of increase since 2006! The blue line on the chart shows the 3 month annualized average that has sharply accelerated higher. See the Photo Section for the chart.
In economic reports for the past four months, housing has been the brightest economic news for the USA. It would be a great benefit to the challenging unemployment situation in the USA today if housing can continue it’s recovery. Nothing will provide more jobs than a strong USA housing market. However, the recovery that is underway is from very low levels and there will need to be significant growth for the housing market to return to the levels found in 1997 – 2007.
In the Photo Section is one last chart which shows New Home Sales for the past 50 years. The chart shows that total New Home sales have now turned higher after declining for the past few years. However, this chart also illustrates just how far New Home sales have fallen from their historical levels. Also we can see the low levels of activity that this recent increase in New Home sales are beginning from.
Forecast for the Next Week
With stock markets and many individual stocks at 5 year highs we continue to urge caution to investors about putting fresh money to work now at these levels. The S&P 500 is now 15% higher from it’s most recent lows attained on June 2, 2012.
We would like to stress to our readers that the USA markets have punished investors who have purchased stocks when they were at their highs repeatedly over the past 10 years.
At the same time we do acknowledge the continued technical improvement in the markets – what we mean by that is that more stocks are participating in this rally then in prior ones. Still the markets at this time are very overbought and this overbought condition needs to be resolved by either a correction or time such as a sideways movement that takes three – four weeks to resolve.
There continues to be a Bernanke put (i.e. Quantitative Easing) supporting the markets that is countering the challenging economic conditions in the USA (see FEDEX CEO comments and unemployment numbers ticking higher over the past few weeks). For the present time though the Fed Quantitative Easing policies are having their intended effect of continuing to propel asset prices higher.